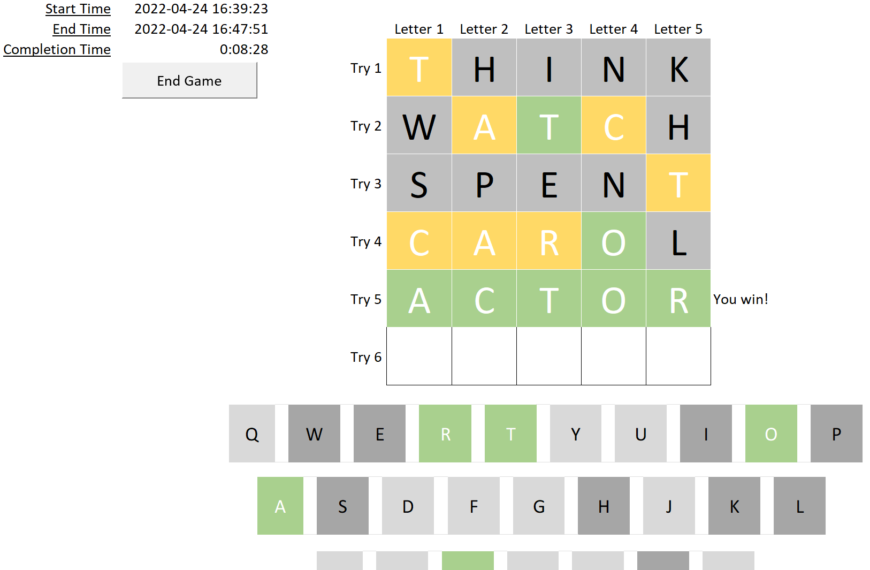
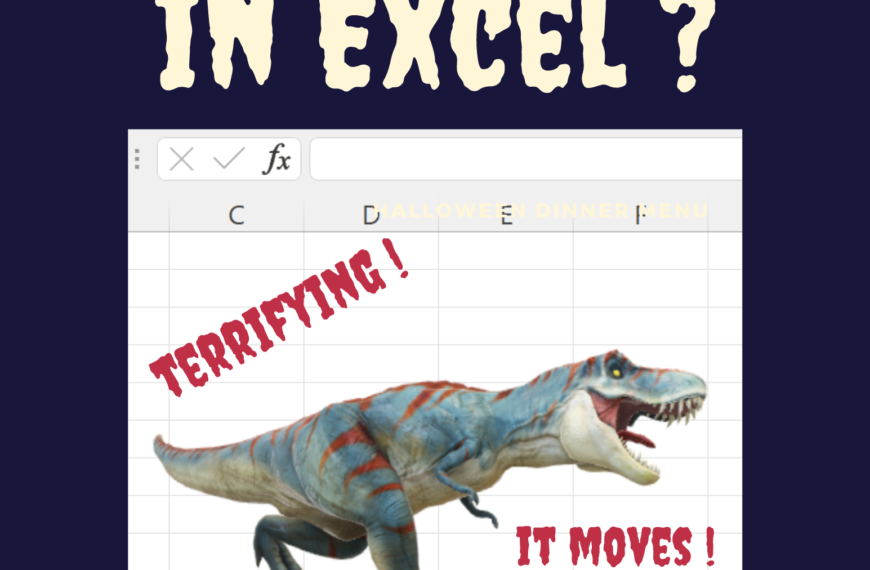
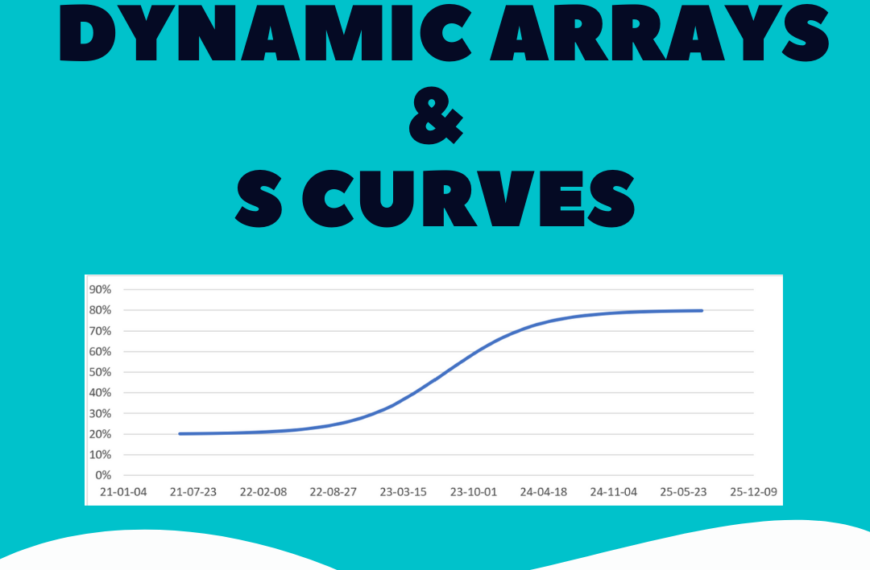
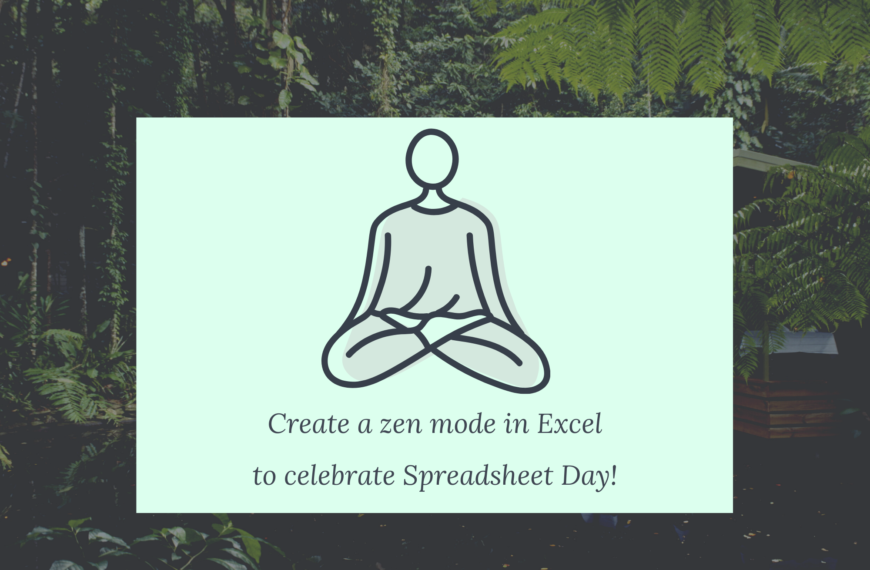
- All
- Art
- Articles
- Auditing
- Challenges
- Efficiency
- Errors
- Excel Intro
- EXCEL Path
- Features
- Formula or VBA
- Formulas
- Free Data
- Get & Transform
- Gurus
- Macros (vba)
- Other
- Pivot Tables
- PowerBI
- Reviews
- Solutions
- Sports
- Stats
- T_Business
- T_Calendars
- T_Checklists
- T_Education
- T_Planning
- Tips
- vba
- Welcome
I was working on a demo file about Excel’s new Data Types but I found an incredible set of templates created by Elisabetta Caldesi!
Let’s forget 2020 but I will review my posts. Thanks Excel for helping me through the year.
Do merged cells irritate you? My latest lame game gives you points for whacking merged cells!
Robert Gascon not only created a shortest formula challenge but he also challenged me to write a post about it!
Is it ok to make one manual adjustment to an automation task to avoid the complexity of a fully automated task?
My last post was about an awkward dataset. Now I’ll review Daniel Choi’s Power Query solution that rearranges the data.
Another awkward dataset. Should we re-arrange the data or just find a way to calculate what we need?
VBA can color certain characters within a cell. It was fun to practice vba and build this but it doesn’t work well with many rows of text.
It’s April 21 and winter is supposed to be finished here in the Toronto area. However, I went for a walk and it’s still cold out! A combination of cold & wind. Let’s calculate the wind chill in Excel.
Let’s take a look at something that’s SO easy to calculate today with a simple spreadsheet but was very challenging to calculate in the past.
Excel is not meant to store historical data. That’s what databases do. However, Tom Urtis shows us a trick to keep the all time min value from a single input cell.
I keep hearing “flatten the curve” during these uncertain times of covid-19. What’s that? What do we do? Also, what can we do to reduce anxiety? For me I decided to create a “flatten the curve” demo in Excel and in Power BI 🙂
For Mr Excel’s recent challenge I decided to go with an old school formula helper column solution. Why? I’ll explain.
My friend Robert Gascon was thinking about Excel formula challenges and Kentucky Fried Chicken (he loves KFC) while drinking a beer.
Let’s explore Wayne Gretzky’s goals (it’s his birthday tomorrow!). I’ve thought of some good questions and one “great” question that we can answer using this dataset. Finally, could Ovechkin break Gretzky’s goal record?
Alan Murray (Computergaga) had an interesting challenge on YouTube. It’s a classic case of “Analyze my awkward dataset!”. He solved it using Power Query. Can it be solved using formulas?
Over the holidays I saw some vba code for checkboxes from the book ‘More Excel Outside the Box’ by Bob Umlas.
I’ll review the posts I wrote in 2019. But first, a challenge inspired by a Wall Street Journal article.
Jordan Goldmeier’s rollover technique runs a VBA User Defined Function when you hover the mouse over a hyperlink formula. Let’s take a closer look!
MMULT function is incredibly powerful and yet mysterious to most. Let’s explore this complex function (this post inspired by a formula challenge from contextures.com )
Let’s explore an advanced way to use Conditional Formatting in Excel. We’ll make a face move around the screen without any vba! Bonus: see how to interact with target cells!
I got this crazy idea for an Excel game while drinking a Space Invader IPA from www.amsterdambeer.com It turned out to be a great way to learn more VBA!
How tall is tall? How smart is smart? How do we compare? Normal Distribution and Standard Deviation answer this. We’ll review the concepts and use Excel to crunch the numbers.
These days dynamic arrays, power query and DAX seem to be all the rage. But let’s not forget about an old friend: VBA UDFs (User Defined Function).
FEN notation provides the necessary info to restart a chess game from a given position. See how I created a FEN viewer in Excel!
In Canada we have long harsh winters but July was REALLY hot this year! How hot? Let’s combine heat & humidity to determine the real temperature we feel.
On July 20 I woke up early and started doing tactics on Chess.com I then noticed an email from Robert Gascon with subject heading “Excel ChessGames Viewer“! Robert also reminded me that it was International Chess Day!
Power Query is a powerful and intriguing tool. However, there are stumbling blocks that make it challenging. Let’s audit and then modify some M code!
Given 3 separate lists of text how can we create all combinations? I’ve known Power Query (Get & Transform) can create a cartesian product but it’s only now that it’s part of my active skill set.
This is a cruel Excel challenge (I’ve used it!). Why? Because there is a brilliantly simple solution to summing cells that overlap two ranges.
This formula =COUNTIFS($A$7:$A$309,$AK4,$B$7:$B$309,1) considers all rows within the given range when counting. What if we want to exclude filtered and/or hidden rows?
Imagine two lists of names. We have three questions: (1)how many unique names in List 1? (2)how many unique names in List 2? (3)how many unique names from List 1 are found in List 2?
In a previous post we saw how formulas can solve a partial match with conditions. Now I will solve it using Power Query because my friend Kunle challenged me to do so 🙂
This Guest Post is contributed by Aprajita Sharma from ExcelChamps. Learn about 3 new charts available in Excel 2019 (or with a Office 365 subscription).
Once again I discovered a formula that I had written down in a notebook. What is it doing? Is there an easier way to solve this?
This post from ExcelFORO explains how to use VBA to create a sorted data validation list. It’s a great solution! Are there other ways to solve this?
I’ll show you the weighted average formula, how it calculates, and I’ll prove that the answer is correct!
So many times vlookup (or index & match) saves the day and gets your answer! ….wait…are you sure it’s correct??? Read this post to see why you should use countifs to confirm your vlookup.
Recently I was asked “How can you prove that the CAGR answer is correct?“. In this post I’ll show you how to verify the CAGR result. I’ll also review CAGR basics and pitfalls.
In a recent post I audited my colleague’s amazing array formula. It extracted the largest number from as420lkjs09nsdk2324lkjsd099 See other solutions suggested by YouTube viewers!
I saw Chandeep’s Data Cleanup Challenge and it looked like fun. Others solved it using Power Query (some amazing solutions) but I used good ol’ fashioned formulas!
A friend shared this challenge: extract the largest number from this text as420lkjs09nsdk2324lkjsd099 ! The answer is 2324. How do we solve this? Formulas? VBA?
How can you improve your VBA skills? Build something! Anything! Even if it’s ridiculous. I needed to practice and ended up creating a robot and a bunch of random style hearts! 🙂
Before you analyze your data it’s important to decide if you need to unpivot it. Why unpivot? What’s unpivot? Are there exceptions?
Rearranging data is initially about recognizing the pattern. This screenshot is from Ken Puls. I instantly saw the steps to rearrange the data (thanks to Ken’s online course!)
Robert H. Gascon’s comment from my last post convinced me that I should be using the INDEX function for dynamic ranges not the volatile OFFSET function.
=SUMPRODUCT(MID(G2,{1;2;3},1)*1) I found this formula in a notebook. Can you understand it’s purpose? I’ll explain it in this post. I’ll also expand it for a more complex case.
The term False Friends is used in various fields including linguistics and chess. In this post I’ll explain how it applies to Microsoft Excel!
My super fit cousin Joe Perry contacted me with a few questions about an Excel spreadsheet he uses to track his running.
Harvard Business Review ranked the top 100 CEOs with three weighted categories (80%, 10%, 10%). I downloaded their data and added some formulas to modify the weighting. Does it make a difference?
I’ve had this ‘Business Formulas’ book sitting around for years. I decided to explore the learning curve formula: (a) create it in Excel and (b) think about the factors that go into learning Excel.
In this guest post Alan Murray (computergaga) compares two solutions to a challenging data sorting issue. I know my preference, what about you?
Excel users who don’t know this concept waste hours manually looking through their data. A filter helps but creating a valid lookup key is what Mr Carlson needs!
Dynamic charts automatically adjust when new data is added in Excel. I’ll show you several ways to create dynamic charts and a few bonus tricks.
HOW DO WE SOLVE THIS PUZZLE? I’m 7 times as old as Lisa is now. In 20 years Lisa will be just half the age I will be then. How old is Lisa now?
See how my Microsoft Excel template can give you an big advantage in your hockey pool!
See how my vacation to Montreal inspired me to create Mondrian style art in Excel using VBA.
In this post I’ll show you how to allocate expenses (or any number) over a period of time. I will use years but it could also be months, weeks or days.
In this post I’ll review my solution to Ken Puls’ Power Query challenge #2. Online challenges are fun and it’s a great way to learn from others.
This year I got serious about learning Power Query! Also known as Get & Transform. Read my post to follow my journey.
In February my wife and I were planning a trip to New York City. I stumbled upon an interesting data-set that MOMA had shared with data.world.
Add a space after each character in a cell. Excel expert Tom Urtis solved it with vba. I solved it using a formula. Let’s compare these methods.
In my last post I used formulas to solve a messy data disaster. In this post/video I’ll show you how to use Excel’s amazing Get & Transform feature (aka Power Query) to re-arrange the data.
Imagine a weekly task of sending out a simple report. To do this you rely on data from someone else. When the layout of the data changes chaos reigns! What can we do?
Let’s review basic picture links in Excel and then explore alternative solutions to picture link limitations. I’ve also included a fun Dashboard to help Oz du Soleil reassess his wardrobe!
Do you ever hold down the Ctrl key to select multiple non adjacent cells or ranges? I’ve found a way to select multiple non adjacent ranges (any sheet) by pasting a formula into Excel’s Name Box!
Last week I was helping a friend build a World Cup pool in Excel. It was fun debating the pool’s scoring rules. I also taught him a few Excel tricks along the way.
Binning numbers and rounding numbers are two separate things in Microsoft Excel. However, there is one interesting binning twist that can be solved using a rounding function.
A data validation drop down list has ‘Beverage’, ‘Food’, ‘Dessert’. You select ‘Food’. In the 2nd drop down list you want to see only ‘Food’ items (‘Chicken’, ‘Meatloaf’, ‘Seafood’). The 2nd list depends on the 1st. This is a dependent drop down list in Excel. I’ll explain my favorite way to solve this.
Years ago, Brad Isaac was working as a stand-up comedian. One night Brad saw Jerry Seinfeld at a comedy club and asked him if he had any advice for a young comic. Read Jerry’s advice and how this applies to learning Excel!
When faced with a challenge in Microsoft Excel it’s rare that two very different approaches can both be equally amazing! In this post I’ll review two completely different solutions from Oz du Soleil and David Hager.
In Microsoft Excel there are often many different ways to create a solution. The best solution is often subjective based on whether we emphasize simplicity or efficiency. Here is a good example:
You created a cool array formula and then merged it across several cells. Later, you realize that you need to modify this array formula. When you try to press Control Shift Enter you get this horrible error:
Every once in a while we get a unique challenge in Excel. This one required some creativity to quickly create a solution due to a pending deadline.
I’ve been a data analyst since 2001. It’s often challenging to accurately & quickly explain certain concepts. There is one that is a classic. I’m going to explain it with the help of Hugh MacLeod’s book “Evil Plans”. No nerdy data terms. The concept first.
How did a New York Times article about the lack of scientific cat research lead me to this spreadsheet: “Affective norms of 875 Spanish words for five discrete emotional categories and two emotional dimensions” ?
During our recent vacation to New York City my wife and I loved eating tacos at TACOMBI. However, when I saw the menu it reminded me of a common data challenge!
One of Microsoft Excel’s most prolific features is the Pivot Table. Pivot Tables offer an efficiency and effectiveness in making sense of large amounts of data in almost no time. With that in mind, we now turn our attention to a scenario where we will create a Pivot Table in five minutes.
I enjoy the dueling Excel podcasts between Bill Jelen and Mike Girvin! The challenges, the energy, the solutions, the community involvement…everything! Let’s look at Excel duel 141 (the PI episode). The best solution depends on asking one question.
How did a Scientific American article help me create a much simpler solution in Excel? And what connection does it have to the Einstellung Effect? Read on and I’ll tell you 🙂
Despite years of experience I still do a lot of Excel google searches. I’m often in a rush and I know which websites to trust. Three of my favorite go to Excel websites are run by: Debra Dalgleish, Mynda Treacy and Leila Gharani.
Have you noticed there’s no way to create bookmarks within a YouTube video? I’ve always thought that it would be a great feature. Well, I have created an Excel template that can do this!
I watched the closing ceremonies of the Olympics last night. It was very nice…but who won the Olympics?
My wife and I recently visited Rouge National Urban Park. We wanted to spend some time away from TV, internet and Excel. We did…but I discovered some data in the Park!
About 16 years ago I discovered HOCKEYDB. I was hooked! Why? Growing up in the late 70s and 80s I was a huge hockey fan but without cable or the internet information was limited. I had so many unanswered questions.
I saw this sequencing challenge from Chandoo “Generate a new sequence number when value changes“. His formula solution is great but I kept thinking “What if we have 20000 rows?“
How can we rank within groups in Excel? Most experts will tell you to use the SUMPRODUCT function. Why? It’s the only solution they know or maybe they’re concerned about compatibility. Is anyone still using Excel 2003? Let’s compare SUMPRODUCT and COUNTIFS.
An ounce of prevention is worth a pound of cure but how does this apply to Microsoft Excel? In this post I will show you a common example. Too late for prevention? I’ll show you two solutions.
Last year I started visiting some REDDIT Excel groups. A few weeks ago I saw an interesting Excel question and provided a simple two step solution.
As Puneet Gogia mentions in his post, we can change text using UPPER, LOWER and PROPER functions but we don’t have a SENTENCE function to capitalize the first letter of each sentence. Puneet solves it with a very interesting formula. How exactly does it work? Let’s audit it!
Some Excel models have so many complex formulas that they just can’t calculate any more. These models often need to be re-created. Some models can be saved by making formulas more efficient. One technique is to add an OFF SWITCH to heavy formulas.
We need to extract unique values from a list to be used in a data validation drop down list. There are many ways to solve this. The best solution depends on asking the right questions.
Is your data validation list is so long that the endless scrolling makes you want to close Excel and never use it again? This post will review several solutions to this problem.
Do you want to become a Microsoft Excel master? The first step might be to convince yourself that it’s possible (it is!). Then, you need some good material and determination!
Stand-up mathematician Matt Parker did a comedy routine about spreadsheets. Hmm….why not create a post about this? How can I make it interesting? My quest to find an interesting angle led me to….well…creating a YouTube Transcript spreadsheeet!
Did you know that an Excel UDF can change the color of a sheet tab? David Hager’s post shows us how to do this! Somehow I came up with the idea to create Christmas Lights using Excel sheet tabs!
On Christmas day, when no one was looking, I peeked at twitter and saw a tweet about an Excel based game called The Worksheet Saga. My first thought was “oh…it’s based on VBA. I wonder if the code is unlocked?”. Read more to see how this game works and how I hacked it to win […]
Subway riders cringe when a delay is announced. Emotions range from mild annoyance to outbursts of anger. Delays inconvenience us and reduce productivity. By default we blame subway management (TTC in Toronto). Is this fair? Wouldn’t it be nice if we had data to determine what causes the delays?
On October 17 we celebrated spreadsheet day. It was a day full of excitement around the globe! Crowds gathered around spreadsheets…dancing and drinking occurred into the wee hours of the morning. Part of the celebration included a lookup formula challenge from Debra Dalgleish (spreadsheet day creator).
Have you ever had the experience where one event causes you to remember something from years ago? This happened to me today while reading the New Yorker magazine. What does Lucas de Groot, a Dutch typeface designer, have to do with Excel’s VBA language? What is “Fontgate”? Well…read on and I’ll tell you!
Data lands in Microsoft Excel in many different structures. Data Analysts like me will often tell you to normalize your data before starting your analysis. This post contains three examples in which normalizing your data might not be necessary when doing a quick analysis.
This Excel puzzle almost sounds like it could be solved with a quick COUNTIFS function but it’s a bit more involved than that. Nevertheless, it doesn’t have to get complicated as it can still be solved using a few simple steps.
I stumbled across this interesting data-set that lists Toronto’s indoor ice rinks. I thought that it would be fun to visualize the rink locations so I used Excel’s 3D Map feature.
Customers can make multiple purchases per month. What is the maximum amount that a customer has spent in a single month? This was a video from the amazing Mike Girvin (Excelisfun). The question is clear, but how did Mike solve it? How would you solve it?
Last week I saw an interesting Excel puzzle from Leila Gharani on YouTube. Leila solved it using a sumproduct function. I made a video showing different solutions. Wasif Mustafa sent me his 3 helper column solution. Then Oz du Soleil created a video showing two solutions. So many ways to solve it!
We can create random data using RANDBETWEEN and INDEX functions. What if you want to create random data that favors some values over others? People have told me that they copy and paste or manually drag the values to repeat them. See how we can automate this with just four easy steps!
One of the highlights of my life was travelling to the 2016 summer Olympics in Rio de Janeiro to watch my sister, Krista DuChene, run in the women’s marathon. Her story is inspirational. Krista fractured her leg on April 28, 2014 during a half marathon and then in August of 2015 she broke a bone in her […]
Despite how amazing Excel is there are times when you’ll find yourself shaking with fear! For example, have you ever seen anything as scary as this =ISERROR(FIND(_xlfn.CONCAT($A2:$E2),_xlfn.CONCAT($I$2:$M$6))) What is xlfn ???
I visit many different Excel blogs. Every once in a while I learn something completely new that really boggles my mind! And in this case the Chess world overlaps the Excel world so it was REALLY amazing (and nerdy)! How do I start to explain how awesome this is?
Although the VLOOKUP versus INDEX/MATCH debate gets most of the attention there are MANY more topics to debate in Excel. When calculating student grades what method is best: NESTED IF or LOOKUP/BINNING TABLE?
Have you ever visited excelxor.com ? It’s an amazing blog with a lot of Excel formula challenges. Here’s one challenge: “given the the 6-by-4 array on the left we may wish to create the single-column on the right“
By default, Excel’s SEARCH function looks for one value inside of one cell. Jon Acampora from ExcelCampus (one of my favorite blogs) demonstrates how to look for various values within one cell with this formula: =IFERROR(LOOKUP(1E+100,SEARCH(tblFilterList[Filter List],[@Name]),tblFilterList[Filter List]),””)
Sometimes life is stranger than fiction. If we were to create this requirement as a hypothetical case many would say that it would never happen. Well, this was a real question that someone had for me. Read this post to see the requirements and how I solved this. I’ve also included alternative solutions from the Excel […]
Recently I saw a link about the World Happiness Report. What is it? “…a landmark survey of the state of global happiness …which ranks 155 countries by their happiness levels” Can you guess what my first question was?
We have a bunch of names in a column. We need to create a unique and alphabetically sorted list. BE CAREFUL! Before we jump into a solution we should ask a couple of key questions. Does the solution need to be dynamic? Do we need to teach the solution to our co-worker or client?
There are many factors to consider when creating a solution in Excel. Are we building the solution for someone else with basic Excel skills? Should we use a complex formula in only one column to save space or use helper formulas to simplify the solution? Let’s take a look at this question from Mike Girvin’s […]
In the movie Forrest Gump I’m sure you remember when Bubba lists different ways to prepare shrimp: “You can barbecue it, boil it, broil it, bake it, saute it. Dey’s uh, shrimp-kabobs, shrimp creole, shrimp gumbo. Pan fried, deep fried, stir-fried. There’s pineapple shrimp, lemon shrimp, coconut shrimp, pepper shrimp, shrimp soup, shrimp stew, shrimp […]
Oz du Soleil and I have been trading Excel ideas for a couple of years now. During ModelOff’s Global Training Camp in Toronto (Sept 22&23) I met Oz in person! Oz flew in from Oregon to deliver one of the Excel sessions. At one point Oz asked the following question: “Given a list of 10 […]
I recently presented at ModelOff’s Global Training Camp in Toronto. One of the many great things about the training camp was that I had the pleasure of meeting Excel guru Liam Bastick.
Such a clear question originating from the classic: “How many unique items per group“?
This post from Tom Urtis reminded me of a crazy Excel puzzle I once solved. The concept was similar except for one tiny twist! First of all, let’s review the original puzzle from Tom:
Who knows what could happen in the future but for now humans using software cleanup and analyze data (not nerdy robots!). This post reviews examples of awkwardly twisted data that require transposing, rotating, repeating, etc before it can be properly analyzed.
I doubt that you have ever seen custom formats presented like this before! Selecting a name from a drop down list changes the custom format and also displays a nerd!
Otis is looking for a date but he can’t find it! Let’s review four solutions that help Otis find a date.
Extracting insights from text can get messy! The good news is that challenging requirements can often lead to very creative solutions!
Excel MVP Oz Du Soleil contacted me a few days ago with an interesting Excel challenge: “how could Excel alphabetize titles, but ignore A, An or The if a title begins with one of those?”
I often use check-boxes in my Excel videos to explain the solution steps. Creating them can be tedious so I thought that there had to be an easier way.
Our task is to repeat each original row three times and then cascade each original number diagonally down to the right.
After we get comfortable with something we create habits and then we often go into auto pilot mode. The danger is that we can fail to see things that are right in front of us!
How do you know whether you should use Excel Formulas or Excel VBA? Sometimes both work and sometimes only one works. This series will explore this question. Let’s start with an idea from Sumit Bansal at TrumpExcel.
What if learning statistics could be fun? Well, Omar Wagih has found a way to do this with a retro style game that teaches correlation!
We’ve all done it. We’ve wasted time looking for Excel content on the web due to inefficient searches.
I did a quiz on The Guardian’s website called “How well do you really know your country?” The pic I saw after the quiz reminded me of Excel’s INDEX function. Yes, I see Excel function names everywhere I go!
This is my first post about exploring free public data sources. Knowledge really is powerful and knowing how people get injured is important in order to learn from it and avoid future accidents.
We don’t always find out how data got twisted into awkward forms. Our job is to fix it by normalizing, unwinding, transposing, etc. Once the data is in the correct format we can then get to the real job of extracting meaning from it.
Some formulas are complex due to a complex question. Other formulas are complex due to inefficient data layout.
In Excel we can bin numbers. We can also bin letters. Rare but possible. However, be careful when binning a mix of letters and symbols! What could go wrong? A student who earns a B- could end up with an A- grade!
If you’ve been working with Excel long enough you’ll notice that some solutions work but can be dangerous and lead to problems.
This was weird. I stumbled across my video and I thought “WHAT? Get all text combinations using just a pivot? How did I do that?” It seemed like ‘Back To The Future’ as I re-watched my own video.
We all have down time while we wait in line or while we commute. How do you use this time? In the past two years I’ve used part of my down time to learn Excel by reading tweets.
What does binning numbers into groups have in common with TV? Well…probably nothing but I had fun combining these ideas while creating this Excel file.
The vlookup function is often used to prove a bare minimum of Excel knowledge because it’s both useful and common.
Excel’s 3D formulas allow you to work with values from the same range in different sheets. However, not all Excel functions work with 3D formulas. Read my post to see how they work, how to go beyond 3D formulas and how to often avoid complex formulas with proper spreadsheet design!
On Friday after work I attended a ModelOff Meetup in Toronto at The Rum Exchange located on 67 Richmond St W. It was a fun event!
Last week I attended one of Bill Jelen’s Power Excel Seminars. The event was hosted by Excel4Apps at the SoHo Metropolitan Hotel in Toronto.
Many of us enjoy puzzles. Sudoku, Crosswords, Chess, etc. I solve a lot of data puzzles using Microsoft Excel. A few months ago, a YouTube viewer had this question for me.
Have you ever received an awkward data set? In my life as a Data Analyst this has happened to me many times in different shapes and forms.
When you want to get a list of Excel file names from a folder and display it in an Excel sheet most people would think about using VBA (Excel’s programming language). But what if you don’t know VBA?
Vlookup returns only 1 value, right? Well…normally yes but there are some tricks to return multiple values (numbers) and add them up.
My Initial Reaction I can’t remember how I discovered Excel.TV but I watched the episode 1 trailer and my initial reaction was something like this: “WHAT???” followed by “Who are these guys?” and “I’ve got to check this out!“.
I have been asked this question many times so I thought I would write this post as a reference that I could share with anyone who wants to improve their Excel skills. Download the Excel file from my OneDrive (file 00126)
Look carefully at the picture below for a few seconds… If you extract all numbers, from left to right, you can create a Date/Time value of Nov 28, 2014 5:08pm (and 51 seconds) in Microsoft Excel.
Is the solution benefit worth the cost? With any product there is a balance between the number of features versus the cost/performance. Race cars and stretch limos have different features and different purposes.
As much as I enjoy sharing my knowledge I have found that this series is just as beneficial for me as it is for others. I sometimes ask myself or others “Do you remember that Excel thing that does….”
How do we define a close Super Bowl game? I was thinking about this on Friday…. It’s got to be more than just the final score point difference. Sure, an exciting finish like the 1991 Giants vs Bills game is a classic.
Have you copied data from the internet and pasted it in Excel? It can be very frustrating when the data is messy! Sometimes there are data quality issues and you should examine the data before adding formulas and formatting.
This template allows you to keep track of events like birthdays and anniversaries. You can also create more events in the ‘Settings’ sheet. In the ‘Input’ sheet you walk through the steps of selecting the event type, adding the individual’s name and date, etc.
I work full time as a Data Analyst currently specializing in Microsoft Excel and Microsoft Access. To keep up to date I watch a fair amount of YouTube videos and follow several websites.
Are you a small business owner or are you thinking of starting a small business? Do you wish you had more hours in a day? If you answered yes to both of these questions then you should do an audit of all of your tasks to see where you can save time. I created a […]
Why do you use array formulas? Why can’t we use a normal Excel function? What does an array formula do? People often ask me questions like these. A quick answer is that array formulas can be used to answer very complex questions about data.
We all need to get things done, right? This free template allows you to plan out tasks and also look back to see if things turned out the way you had planned. Download the free template You can download the file here or here from my OneDrive (file 00099)
Have you ever inherited a messy Excel file? It can be REALLY painful! Over the years I have used various techniques to audit Excel files. This post shows you how to distinguish between different error types, count them and find them!
Dean Pelton has a problem. His menu is alphabetical and has too many meatball recipes. Watch as Bill Jelen (aka Mr Excel) helps Dean: Mr Excel helps Dean Pelton But how can I help Dean?
Here is an Algebra equation: 9x – 7 = 47 If we know the value of x we can easily determine if the left side = the right side. But in this case x is not a single value but rather a Domain (a set of numbers). x can be 5, 6, 7 or 8. […]
A Classic Excel Problem In large spreadsheets if you drag formulas down too far then you are increasing the calculation time and also the chances that Excel will freeze and/or crash.
Something weird is going on here… You’re trying to compare two lists of data to see what items from ‘List B’ are in ‘List A’. Sounds simple enough, right? But some of the lookup values are not found even though you can clearly see the value in ‘List B’.
Sometimes our data isn’t perfect and we just have to deal with it. In this post you’ll see an awkward data-set from Mr Excel with a VBA solution from Bob Umlas and a formula solution from me.
Hide and Seek Imagine a data validation drop down list with many names that are not sorted. Trying to find a particular name in that list would get frustrating as the list grows. Did you know that there are ways to sort text in Excel?
This Excel file is more of a custom solution than it is a template. So, why share it? Because, you can learn a lot about Excel by auditing formulas! Take apart the template and see how it works (password is ‘test’).
Imagine a column of numbers. Each number is 3 digits in length. If we select 127 then we want to also hide 127, 172, 217, 271, 712, and 721 (six unique orders). In this video I show you two possible solutions.
We can use Excel’s MIN function to find the minimum number in a range. As date values are technically numbers, the MIN function can show the oldest date. But….how can you find the Monday before the oldest date???
Web Based Planner or Spreadsheet Wedding Template? There are many different on-line wedding planners. For example, click here to see Marha Stewart’s on-line wedding planning tool.
How do you add 20 minutes to a time value in Microsoft Excel? What is the difference between a time value and a date & time value? There’s a lot of confusion about data and time values in Excel but it’s easy to learn!
SWOT = Strengths, Weaknesses, Opportunities, Threats Enter strengths, weaknesses, opportunities and threats. For each entry, you select “Y” to display it in the output sheet or “N” to hide it (no need to erase the entry and then have to type it back in later).
Question: Why use an array formula? Answer: You can answer a complex question using only 1 array. In this video, the array uses the EXACT and LEFT worksheet functions.
Question: Why use an array formula? Answer: Because you can answer many complex questions using only 1 array formula! In this video, I use an array formula to extend the use of Excel’s LEN function.
Why would I need an array formula? I have heard this question so many times over the years! If you have never ever used an array formula than this video is for you. Don’t worry….No prior knowledge is required. I explain things slowly.
Create a dynamic hyperlink using an array formula! This means that you can jump to a location in your data depending on conditions in the values. This is one of my favorite ways to use an array formula!
Requirement: Identify all items within a group if any of the items in that group meet a condition. Solution: This time I use the SUMPRODUCT function for a quicker solution. SUMPRODUCT can be used to count with conditions (within the same group).
Requirement: Identify all items within a group if any of the items in that group meet a condition. Solution: I use functions VLOOKUP, AND to identify rows if a condition is met within the same group.
Learn how to add numbers in Microsoft Excel using these functions: SUM, SUMIF, SUMIFS.
Use Excel’s data validation feature to restrict values that can be entered into cells. Data validation can save you hours of data cleanup work!
A hyperlink is an easy way to jump from one location to another location. The destination could be to the same workbook, an external workbook or a website. There are two ways to create a hyperlink in Microsoft Excel:
Watch this video to learn how to combine the offset function with a combo box. This will make it easy to retrieve the desired value from your data.
Learn how to retrieve a value or several values using Microsoft Excel’s offset function. Offset is one of my favorite functions due to it’s flexibility.
What’s the difference between Compound Interest and Simple Interest? I know that there’s a difference but I often forget the details so I created this video for you and for me!
Calculate the future value of your money in Microsoft Excel using the Future Value function.
Learn how to group a column of dates by Year & Month and sum another field. Excel’s pivot table ‘Group’ feature only takes a few clicks of the mouse and can save so much time!
Learn how to exclude data from a pivot by using a report filter.
Learn how to hide rows using Excel’s FILTER feature.
Learn how to use Excel’s various count functions to count numbers, blanks, non blanks and how to conditionally count (count if a condition is met).
Watch this video to learn how Microsoft Excel handles dates and times. Also, learn how to find errors in your date values.
Data in each cell should represent 1 thing (i.e. one ‘City Name’ or one ‘Country’). If various fields are pushed into 1 cell then learning Excel’s -Text To Columns- feature will save you many hours of work!
Learn how to sort data in Microsoft Excel using the sort command.
This video reviews two parameters of Excel’s vlookup function (‘col_index_num’ and ‘table_array’).
Excel’s vlookup function is the most common lookup function. It’s often used in job interviews as bare minimum proof of Excel knowledge. Are you using vlookup correctly?
If you’ve created a pivot table and later added more data then you’ll need to expand the pivot’s data range.
Advanced uses of the SUMPRODUCT function including how to incorporate “this or that” logic.
Learn what Excel’s sumproduct function is really doing. See what’s going on inside by evaluating it. Remember this: the F9 key is your friend!
A quick review of the Sumproduct function and 2 more examples.
Are you looking for something in your Excel data? Excel’s FIND feature is great when you want to quickly find something in your data. But what if you keep repeating the same searches?
Watch this video to learn more about sheets in Excel (i.e. rename, move, copy, select, delete, insert, etc.)
Use this free Excel template to compare various quotes for each budget item. See how much you would save by changing the quote.
If you work with data in Microsoft Excel then you have to learn about Pivot Tables! Learning Pivot Tables will change the way you work with Excel!
Watch this video to learn how to use Excel’s powerful FIND feature. You will save so much time once you learn how to use this feature!
Watch this video for tips on how to enter data in Microsoft Excel. Some of the tips could save you a lot of time.
Save time by discovering efficient ways to navigate within a sheet in Microsoft Excel.
Many people have asked me about Excel’s sumproduct function. It is one of Excel’s most versatile and useful functions. Here is an introduction video.
Microsoft Excel Formula Introduction If you have never written a formula in Microsoft Excel then this video is for you. No prior knowledge is necessary.
A bucket list is a list of the things in life that you really want to do. Not so much the daily tasks like take out the garbage or clean out the fridge. Fun stuff like travel to Europe (done!), take tennis lessons or learn to speak Italian.
Can you remember being called to the front of the class to do a math problem?
MoneySense magazine has a great article about weddings called “A recipe for wedding magic” written by Mark Anderson. One of the most important decisions is to decide on the guest list.
In this video I introduce Excel 2010′s Window. Excel’s window has the following components: Name Box, Formula Bar, Worksheet, Status Bar, Worksheet Tabs, Views, Zoom Level, Scroll Bars.
In this video I introduce Excel 2010’s Ribbon. The Ribbon is a new way to display Excel’s many commands. The Ribbon is found at the top of the screen and consists of various ‘Tabs’. ‘Tabs’ consist of various ‘Groups’ of commands.
What is this site about? This is my personal blog about Microsoft Excel. What can you learn?