


Many of us enjoy puzzles. Sudoku, Crosswords, Chess, etc. I solve a lot of data puzzles using Microsoft Excel. A few months ago, a YouTube viewer had this question for me.
Kevin, Is there any method to extract the below data sets of 12 into what you just described in the video using the ‘offset’ function? The problem I encountered is that the “# of items per set” is not equal. However the values I need to extract into separate columns do have table field names separated by a “:” There are no blanks in between data sets. The spreadsheet I referred here has more than 1500 data sets or records. Following are the field names in the table: DBV: RTX: VIN: Grouper: Grouper2: Grouper3: As you can see below, only the 12th record set has the 5th field name ‘Grouper3’, otherwise I could have used the method described in your video. ‘Grouper3’ table fields are blank from record record set 1 to 11 hence during export, the application skipped the field name. The data was extracted from an application table. Front end users can only export data into a .txt file format.
Description
It’s helpful to read a description of the requirements. What’s even more helpful is to see the data.
However, for me, the most important part is the combination of seeing the data and speaking with the person to clarify the requirements. People may accidentally omit relevant details while also providing a lot of non relevant details (like a high school math question with some false info).
Once this is done, I can usually determine whether a solution is possible and estimate the required time for completion.
What Do We Have? What Should It Look Like?
What’s the Pattern?
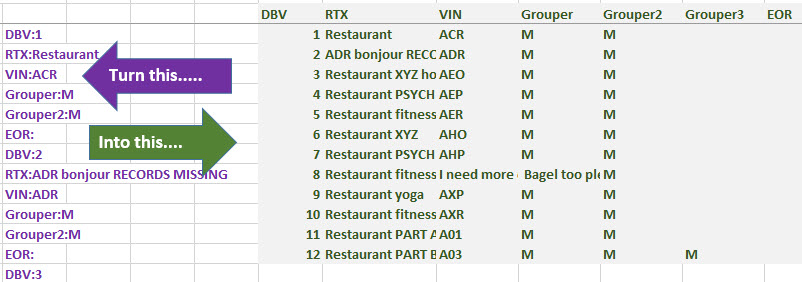
We see that data is stacked in one column on the left and needs to be split into a row for each record. Field names are always followed by a colon with the data after the colon. Some fields are not present in all records. So, I glanced at the data and I had two questions:
- Does ‘DBV’ always indicate the start of a new record? Yes.
- Is the data sorted correctly from top to bottom? Yes.
Does the End User Want to Learn?
Before solving, determine if your end user wants to learn how the solution works or if they don’t care and just want a quick solution. If he/she wants to learn then try to create a solution with clearly labelled solution steps. If not, you might be able to work faster and create fewer and possibly more complex formulas.
Live Solution versus Improved Solution
When I recorded the video I didn’t rehearse anything. The video is longer as I had to think of a solution and correct a few things. After I finished recording I thought of a better solution. It’s in sheet ‘Improved Solution‘.
Practice! Try to Solve it!
Download my file below and in sheet ‘Try Solving It Here‘ well….try to solve it!
Download my Excel file
Download here or via my OneDrive (file 00122)
Watch my YouTube video
About Me
 My name is Kevin Lehrbass. This is my personal blog about Microsoft Excel. I live in Markham, Ontario, Canada. I’ve been studying, supporting, building, troubleshooting, teaching and dreaming in Excel since 2001. I’m a Data Analyst.
Hundreds of millions of people use Excel everyday. Thousands of hours can be saved and costly errors can be avoided or corrected if you study this powerful software. Check out my videos and my blog posts.
Away from Excel I enjoy playing with my dog Cali (she doesn’t like Excel), learning Spanish, playing Chess and drawing nerds.