


We can create random data using RANDBETWEEN and INDEX functions. What if you want to create random data that favors some values over others? People have told me that they copy and paste or manually drag the values to repeat them. See how we can automate this with just four easy steps!
Sample Data-set
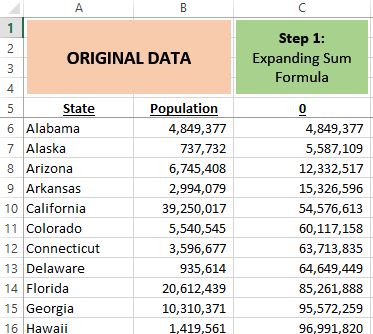
Let’s use population by state for the United States.
STEP 1 EXPANDING SUM FORMULA (Cumulative Sum)
Our original data: ‘State‘ and ‘Population‘. Add this formula in cell C6 =B6+C5 alongside the data.
STEP 2 CREATE RANDOM NUMBERS
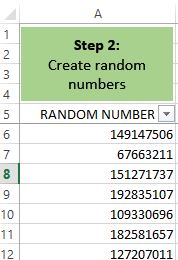
Add this formula =RANDBETWEEN(1,’Original Data’!$D$5) that creates random numbers between 1 and 319451069 (total sum of the population).
STEP 3 APPROXIMATE MATCH INTO STEP 1
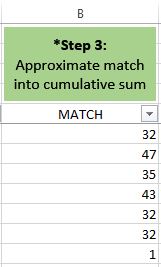
Add this formula =MATCH(A6,’Original Data’!$C$5:$C$55,TRUE) that bins our random number back into our expanding sum. We bin using TRUE (approximate match).
STEP 4 INDEX FUNCTION GETS OUR ANSWER
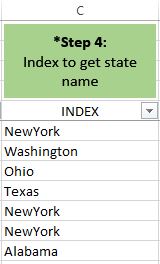
Add this formula =INDEX(‘Original Data’!$A$6:$A$55,B6) Index function references our ‘State’ values using the match function result (Step 3) to display a state.
Excel File & YouTube Video
Here is my Excel file (or get it here from my OneDrive). Here is my YouTube video.
Solution Recap
Step 1 runs alongside your original data. Drag it down further if you have more data.
Steps 2, 3, and 4 are dragged down as far as you want in sheet ‘Randomly Created Data’. If you don’t drag the formulas down very far you’ll see more variation.
Sheet ‘Pivot & Formulas to Verify’ shows how close our randomly generated data is to our original state population data.
That’s it, we are finished!
—————————————————————————————————————————–
But wait……
Can We Vary The Randomness?
What if you want more variation in your random data. After all, isn’t it supposed to be random?
Fasten your seat belts ladies and gentlemen. It’s about to get nerdy!
Random Variation Options
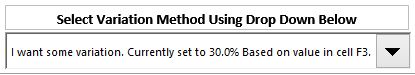
I have extended our solution to give us these three options:
- Use original expanding range (smallest variation)
- I want some variation. Currently set to 30.0% Based on value in cell F3
- I want to add variation manually (using columns H & I)
Option 1 smallest variation if we’ve dragged formulas far enough in sheet ‘Randomly Created Data’
Option 2 typing in a % value in cell F3 increases/decreases (random) the individual state population
Option 3 manually type in a positive/negative number (added/subtracted to state population)
Option 2 is selected above. Randomly add or subtract a percent of each state’s population.
The randomly generated ‘State’ data in column C (sheet ‘Randomly Created Data’) is updated. Refresh the pivot in sheet ‘Pivot & Formulas to Verify’ to see the variation.
Isn’t that cool?
Excel File
Here is my Excel file (or get it here from my OneDrive) that includes the additional variation options.
Equally Random Data-set?
Simply change the numerical values to be the same value (i.e. 1).
Or, check out these solutions from Exceljet and Contextures.
Random Stuff About Me
 I like: pineapple, mushrooms, olives, coffee, chocolate mint ice cream, NBA, listening to Spanish radio, data (obviously), my dogs, playing chess, drawing nerds and listening to music on Spotify.
Random Facts: I’m tall but not freakishly tall unless I’m in Costa Rica for work where the average height is lower and I’m 3+ standard deviations above the average height (hence the increased stares). I met NBA legend Bill Walton at the top of a pyramid north of Mexico City. I like book stores. I have a better than average memory (according to my siblings). I am a long-suffering Maple Leafs fan (if the Red Sox and Cubs can win we can too!).
Strange: Before the age of 40 I had never traveled to Europe. I simply had to go! After the initial trip I then had two business trips to Europe (3 trips to Europe in about 4 years!). Blindfolded I can tell the difference between Starbucks, Tim Hortons and Second Cup coffee. I’m a decent chess player but I could never solve a Rubick’s Cube (I got four sides once). I have an abnormal obsession with Microsoft Excel (or so I’m told). In a previous job I was allowed into the computer server room to test if databases were running. I wasn’t allowed to type or touch anything so I had to verbally spell out the SQL queries to another IT person who had permission to type.