


Harvard Business Review ranked the top 100 CEOs with three weighted categories (80%, 10%, 10%). I downloaded their data and added some formulas to modify the weighting. Does it make a difference?
Harvard’s CEO Rating
Here is a summary of their methodology (or read the article)
In a business world that often seems obsessed with today’s stock price and this quarter’s numbers, our ranking takes the long view: It’s based primarily on financial returns over each CEO’s entire tenure—and because these CEOs have been successful, many have enjoyed a long run in the job. (CEOs on the list have been in the position for an average of 16 years, versus an average in 2017 of 7.2 years for S&P 500 CEOs.) To calculate the final rankings, we also factor in each company’s rating on environmental, social, and governance (ESG) issues.
Three Categories
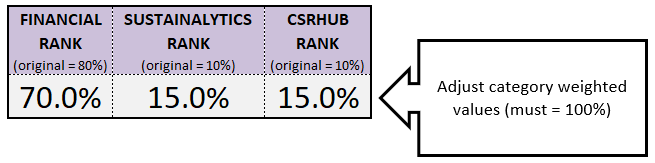
(1) FINANCIAL 80%, (2) SUSTAINALYTICS 10%, (3) CSRHUB 10%
The financial metric consists of an average of three metrics (country adjusted total shareholder return, industry adjusted TSR, change in market capitalization).
Non financial metrics were split between sustainalytics and csrhub. From my understanding both are related to environmental, social and governance factors (knows as ESG).
Weighted Category Sensitivity
Here’s what I’ll do in this post:
- recreate the existing ranking using their raw data
- test the sensitivity of the category weights
- use Excel formulas & features to summarize results
The Data
I was pleasantly surprised when I read:
Download the Data behind the Ranking
My Excel file allows you to change the weighting easily plus some nerdy stuff. Here is the original link where you can find the data.
Recreate Existing Ranking
In my file (sheet ‘DATA’ column W) this formula recreates the final value:
=(T3*0.8)+(U3*0.1)+(V3*0.1)
A simple rank of above value in column X confirms the original hard coded rank in column A.
Sensitivity of Category Weights
In sheet ‘Dashboard’ change category weightings in cells B18, C18, D18. Each cell is a named range.
Column Z in sheet ‘DATA’ has this formula for the Adjustable Weighting Final Value:
=(T3*FINANCIAL_RANK)+(U3*SUSTAINALYTICS_RANK)+(V3*CSRHUB_RANK)
Column AA has the modified rank. Look at the visual in column AB to compare the original rank with the modified rank.
Summarize Results
Scrolling down column AB shows you the rank gain/loss difference. There’s minor changes in the top 12 but further down we see a fair amount of change.
Correlation
Below we see that correlation is high for value and value rank based on original weight (80% 10% 10%) versus modified weight (70% 15% 15%).
![]()
It means that the two columns of rank values are very similar. However, if we modify weighted values to 50% 25% 25% we see the correlation values dipping to 0.60 and 0.65.
Top 10 Gain & Loss
Changing the original 80% 10% 10% weighting to 70% 15% 15% has a big impact on several CEOs.
![]()
Top 10 Loss has a similar result. For example: Jeffery Bezos drops from rank 68 all the way down to 97.
Other Stats
I found several stats to be interesting/concerning:
- 44% of these CEOs without MBA or Engineering degree
- Average age of these CEOs is 60
- Only 3% of these CEOs are women
About Me

Harvard, you had me at “Excel file” 🙂
My name is Kevin Lehrbass and I’m a Data Analyst. I live in Markham Ontario Canada.
I love working with data in Microsoft Excel. Sure, I can write SQL statements and that’s fun too but Excel is my favorite.
Whenever I hear about a top X for cities, MBA schools, CEOs, etc I’m always intrigued to learn about the methodology and play with the numbers.
This post’s source link https://hbr.org/2018/11/the-best-performing-ceos-in-the-world-2018