


This Excel puzzle almost sounds like it could be solved with a quick COUNTIFS function but it’s a bit more involved than that. Nevertheless, it doesn’t have to get complicated as it can still be solved using a few simple steps.
What’s The Exact Requirement?
Instead of counting individual numbers that are above or below our targets we need to count the groups that are above or below our targets.
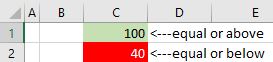
Our max target is currently set to 100 and the min target to 40. Our solution needs to be dynamic as these limits (inputs) can be changed at any time.
In the pic below, conditional formatting helps us see the first group of numbers that are all above our upper target of 100. The 91 is below 100 so the group stops at value 101. Further down we see a 2nd group with the values 104 and 106. In this sample we have 2 groups. We also have a lower limit of 40 that works in the same way.

How Much Data Do We Have?
Before we jump into “Solution Mode” it’s important to know the amount of data. We have 30007 rows of data. File size for this raw data is 256KB (using Excel 2016 64 bit).
How Should We Solve This?
Can we use a single formula to solve this? Who knows, maybe it’s possible but it would be a very complex multi function formula. I know that VBA could solve this but that would take me all day to write the VBA! I solved it with two helper columns (it could be reduced to 1 helper column) and then a simple COUNTIFS function.
Visualize What I Want To Build
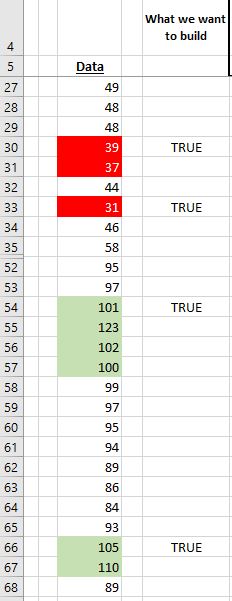
I’d like to identify or flag the first number in each group that’s either above our max number or below our min number. I’ve hidden some rows in the pic below to show more groups.
Solved Using The AND Function (Steps 1, 2, 3)
If you download my Excel file you’ll notice that I use formula =AND($C9>=$C$1) in cell F9. This is my “get started” approach. This formula flags all values above our max target.
In cell G9, I extend this formula to =AND($C9>=$C$1,$C8<$C$1) so that it flags only the first value in the max group.
I can now easily modify this to also work for the MIN groups: =AND($C30<=$C$2,$C29>$C$2) This formula is from cell H30.
A final formula counts the TRUE values in columns G & H =COUNTIF(G6:G30012,TRUE)+COUNTIF(H6:H30012,TRUE)
Do We Really Need Two Helper Columns?
We can reduce the solution down to only one helper column (‘ALL IN ONE’). In cell I6 I use this formula:
=OR(AND($C6>=$C$1,$C5<$C$1),AND($C6<=$C$2,$C5>$C$2))
We are simply dropping each of the AND formulas inside of an OR formula.
I use this formula to count the TRUE values in column I =COUNTIF(I6:I30012,TRUE)
Get My Excel File & Watch My Video
Download my Excel file here or from my OneDrive (file 00166). Watch my YouTube video.
About Me
I’ve been a Data Analyst since 2001. Mostly Excel and SQL. When I’m not writing formulas I occasionally doodle. I have no idea why I started doodling. It just happened. I also have no idea how to edit these doodles so I often end up editing them in Excel 🙂