


I stumbled across this interesting data-set that lists Toronto’s indoor ice rinks. I thought that it would be fun to visualize the rink locations so I used Excel’s 3D Map feature.
Where Did I Get The Data?
I found the Excel file here (city of Toronto). At the bottom see “Indoor Ice Rinks Data”. The Excel file is only 18kb containing 13 columns and 54 rows of data. Check out the SQL statement in cell A2 (sheet “SQL”). You will need to increase the size of the formula bar to see all of it!
What Does The Data Look Like?
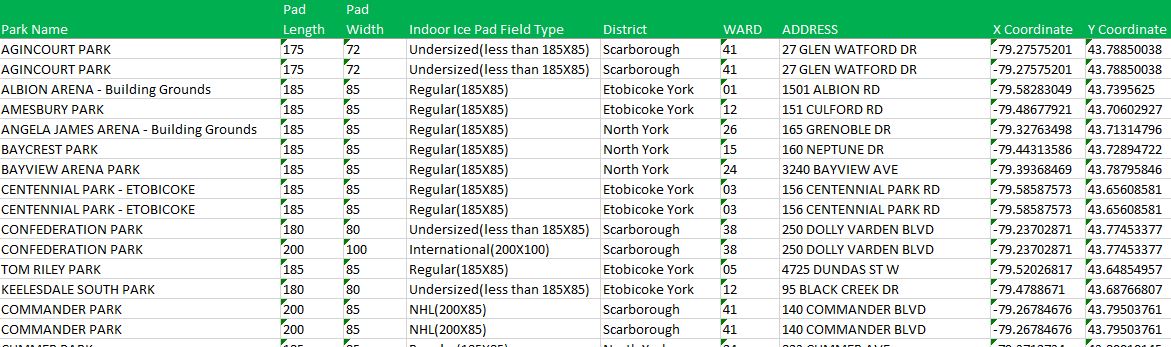
This pic shows most of the fields. Notice ‘Pad Length’ and ‘Pad Width’ fields along with ‘Indoor Ice Pad Field Type’ field. It’s Canada, what did you expect?!
Visualizing The Data
When I saw the ‘X Coordinate’ and ‘Y Coordinate’ fields I wondered if I could finally use Excel’s 3D Map feature! As I have lived in or around Toronto since July of 2000 I thought it would be interesting to see the ice rinks plotted on the map.
My Toronto Indoor Ice Rink 3D Map
Despite my lack of experience working with maps it was very easy to create this! The color indicates the district of Toronto and the height indicates multiple rinks in the same location.

Building this 3D Map
In Excel 2016: click ‘Insert’ on the Ribbon and then ‘3D Map’. You might need to install it but it doesn’t take too long.
In the ‘Layer Pane’ go to ‘Location’. Click ‘Add Field’, select field ‘X Coordinate’, in the drop down list select ‘X Coordinate’. Repeat for ‘Y Coordinate’. These fields were named perfectly!
In the ‘Layer Pane’ go to ‘Category’. Click ‘Add Field’, select ‘District’. This not only assigns each District a color but it also add the height (higher means multiple rinks per facility.
Adding Detail to Data Points
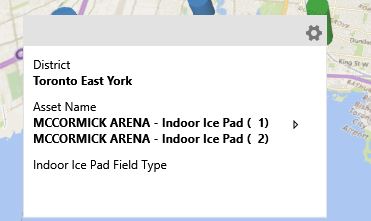
Hover over the data points (rinks) and you’ll see additional information. Click on the wheel icon (top right of pic) and you can customize what you display when hovering over the data points.
Map Controls
In the bottom right of the map you’ll find these control buttons. The arrows rotate and the + – zoom in and out. It’s really easy to use!

Map Labels
On the ribbon at the top press ‘Map Labels’ to add highway names, street names and neighborhood names.
Excel File
Here is my Excel file. You’ll need to have 3D Map installed to view the map.
Conclusion
I was impressed with how easy it was to build the map. Yes, other mapping software have more features, but Excel 3D Map was so quick and easy! If you just need the basics then I would highly recommend using 3D Map. If you’ve already got Excel 2016 (I’m not sure for previous versions) then you simply enable the 3D Map add-in and start playing around with it!
About Me

My name is Kevin Lehrbass. I live in Markham, Ontario, Canada. I’ve been studying, supporting, building, troubleshooting, teaching and dreaming in Excel since 2001. I’m a Data Analyst.
There are so many amazing things that you can do with this powerful software. Check out my videos and my blog posts.
Away from Excel I enjoy learning Spanish, playing Chess, hanging out with Cali and Fenton and reading Excel books