

Alan Murray (Computergaga) had an interesting challenge on YouTube. It’s a classic case of “Analyze my awkward dataset!”. He solved it using Power Query. Can it be solved using formulas?
(read Alan’s LinkedIn post)
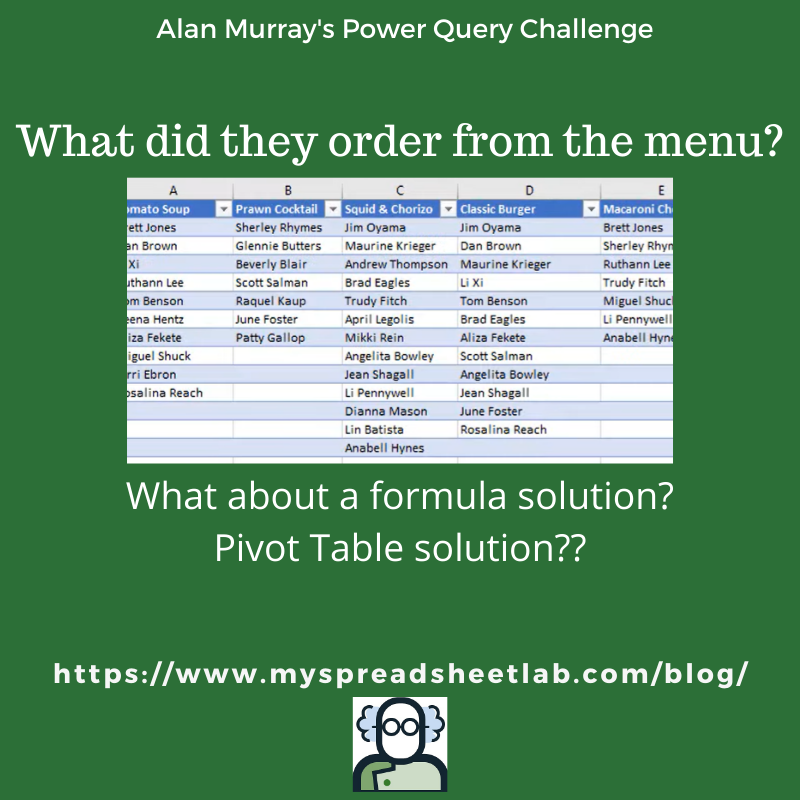
The Dataset
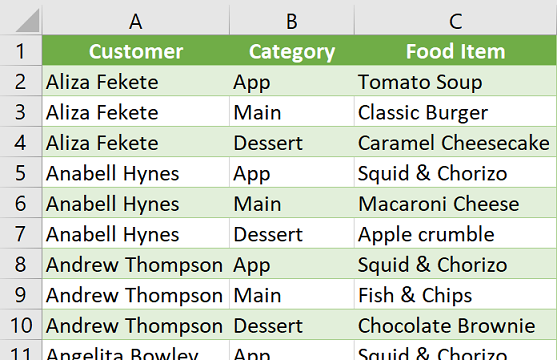
Alan received the data in this layout:
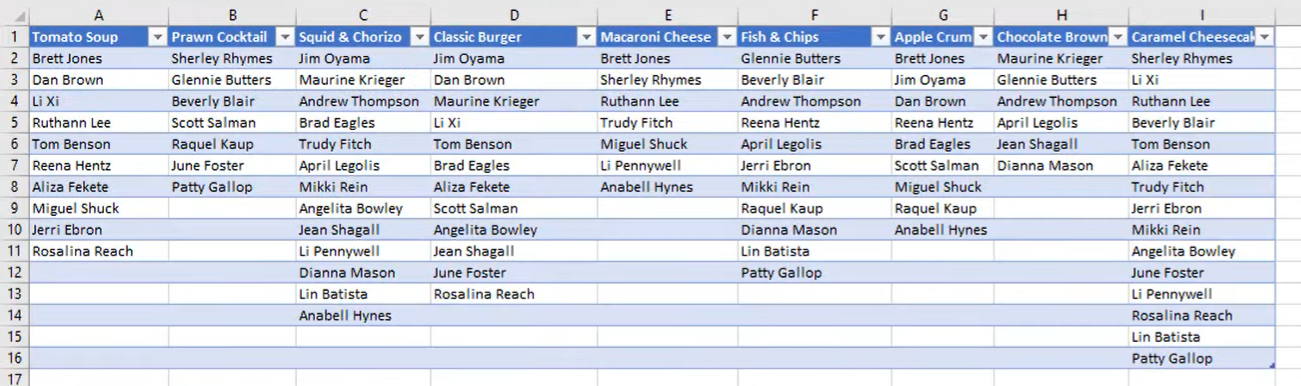
Each customer is allowed 1 appetizer, 1 main dish, and 1 dessert.
Columns A, B, and C are appetizers. D, E, and F are main dishes. G, H, and I are dessert.
Required Output
Alan’s client wants to see the following outputs:
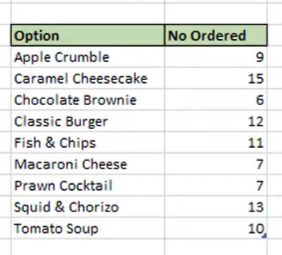
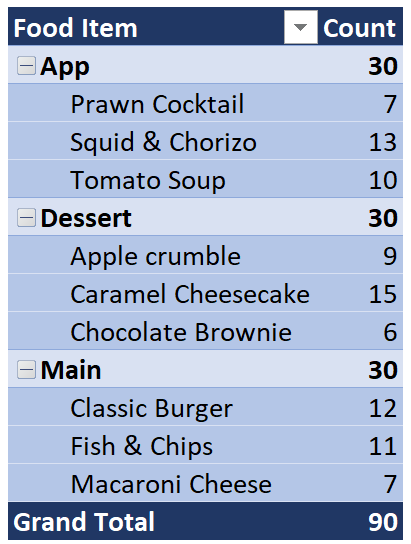
Order Count Per Food Item
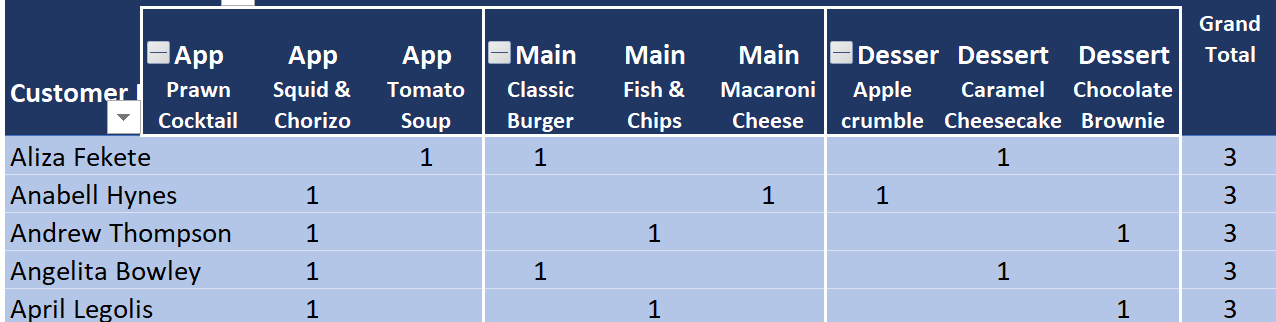
Items Ordered Per Customer

Power Query Solution
Alan and Oz solved this using Power Query. Slightly different approaches but the same output.
Power Query is the best way to solve this. Given an awkward dataset, Power Query rearranges the data and solves both requirements. Final answers get pushed back into an Excel sheet.
Formula Solution?
(download my Excel file)
Some people insist on a formula solution. Can Dynamic Arrays make a formula solution easier?
(remember: dynamic arrays are a new feature. As of Jan 2020 most Excel users don’t have them)
Requirement 1: Order Count By Food Item
(a) COUNTA in row 1 counts food items.

(b) TRANSPOSE function rearranges data as required. Cell K3 formula spills across and down.
![]()
Just 2 quick steps solves this.
Transpose function is not new but it now spills!
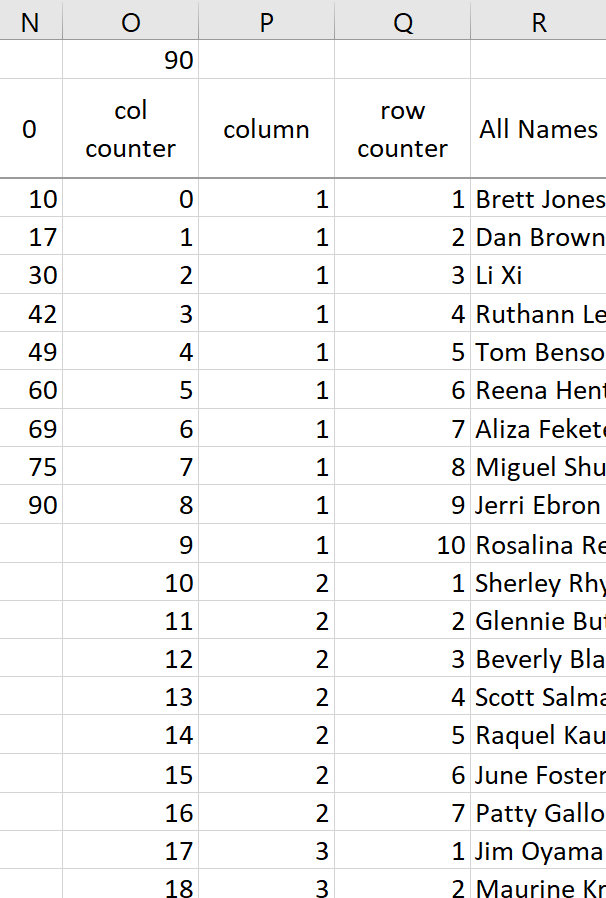
Requirement 2: Items Ordered Per Customer
This part has several steps. We need to stack names, spread across columns A to I, into 1 column.
Column N is a growing range based on column K.
Column O is a simple counter. Columns P & Q give us the co-ordinates to extract the names.
Column R stacks all the names (including repeats).
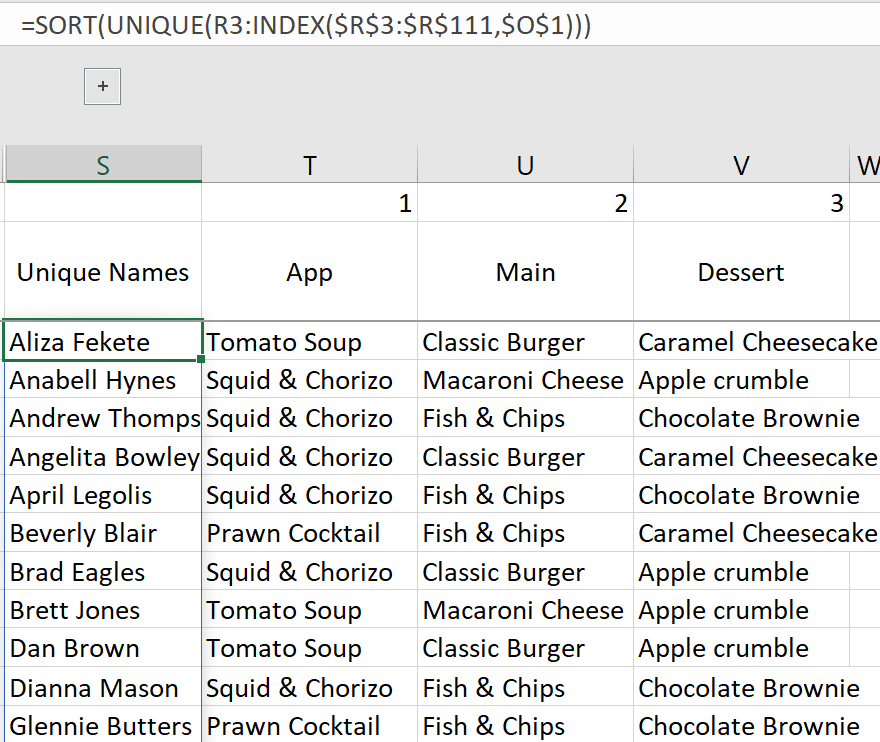
Column S formula below spills unique name list. Add/change names in input area (columns A to I) and column S updates.
Formulas in columns T, U, and V extract selected food items for each customer.
Dynamic arrays make it easier to solve but it still requires multiple steps. Is there an easier solution?
Better Data Layout?
(download my Excel file)
We often can’t change the data layout. But what if we could? How would we change it?
If Alan convinces the client to input the data in this format then the output takes seconds!
This is a pivot data layout. We have 3 things (Customer, Category, Food Item) so we need 3 columns.
We can make the first pivot in a few seconds.
Pivot Table 2 has a different look. It allows for multiple item orders and can also be created in seconds.
Power Query and formulas are so powerful but sometimes they aren’t necessary.
Teaching someone to setup their data in a database/pivot layout along with basic pivot table knowledge empowers them. It can lower their developer costs and turnaround time. It’s not enough to have clean data. It’s also important to have an optimal data layout.
If you can’t change the data layout then Power Query or a bunch of formulas save the day!
Checks & Balances
What if someone forgets to make a selection? What if someone orders too many items?
I made a copy of the data and removed a few rows to demonstrate how a Pivot can identify those who have less than 3 entries. True, someone could have ordered 3 items (2 desserts and 1 main). That would require a bit more work. But, the idea is that when the data is arranged properly it’s much easier to analyze it.
About Alan & Oz

Alan Murray is from Suffolk England. He is an Excel and IT trainer.
Visit his blog and YouTube channel for hundreds of free tutorials! His videos are always clearly explained.
Alan also has Excel video courses that you can take.
 Oz du Soleil (on the right, me on the left) lives in Portland Oregon.
He was an early Power Query adapter and has bounced around the globe training people in Excel. Oz has an extremely engaging and witty presentation style 🙂
He also has some amazing video editing skills!
This past week Oz presented at an Excel Meetup organized by Alan in London England.
About Me

My name is Kevin Lehrbass. I’m a Data Analyst.
I watched Alan’s video and then Oz’s video on an empty stomach. All the references to food made me really hungry! I had to stop and have some butter chicken and then some guacamole!