


In this post I’ll review my solution to Ken Puls’ Power Query challenge #2. Online challenges are fun and it’s a great way to learn from others.
Ken’s Challenge #2
While reading Ken’s post I had a flashback to the 1980s when I was in high school. My dad would sometimes help me with math and would remind me to focus on the facts that were required to solve the problem and ignore everything else. My dad would have been an amazing data analyst, accountant or programmer.
So…Ken has given a summary of the challenge and I highlighted this part:
…generate a list of all the transactions pertaining to customers who have purchased from multiple business units
In other words, if a ‘Customer’ has purchased 2 or more distinct ‘Membership’ types then show all transactions for these customers.
The Data
Here is the original data (transactions) for this challenge.
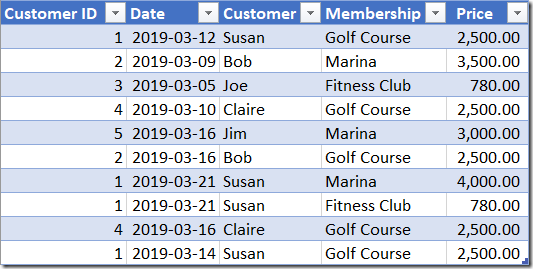
Look at ‘Customer ID’. You can see that only Susan and Bob have 2 or more distinct memberships.
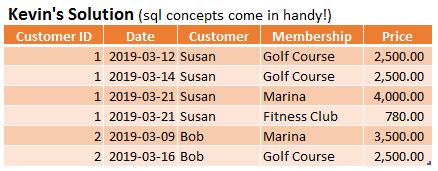
Ken has provided what the Power Query output should look like. All transactions for Susan and Bob:

Excel File
Download my Excel file and follow along 🙂
The Solution
Sometimes I have to rack my brains to think of a solution. In this case it came to me quickly due to my experience writing SQL queries.
- group by CustomerID, count distinct Membership
- filter to those with 2 or more
- join this result back to original transactions
These are the basic concepts. Let’s build the queries!
4 Queries
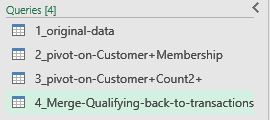
Why 4 queries? Some could solve it via 1 complex query. If I were to audit this in a year would it be easy on the future me?
Query 1 “1_original-data”
Simply load the data from the original table.
Query 2 “2_pivot-on-Customer+Membership”
Simple step of removing unneeded columns (prepping for pivot). I recommend reading the code that’s produced by your mouse clicks. Most of it is easy to understand.
= Table.RemoveColumns(Source,{“Date”, “Customer”, “Price”})
Query 3 “3_pivot-on-Customer+Count2+”
Now it’s heating up! Group by CustomerID, count distinct in field Membership:
= Table.Group(Source, {“Customer ID”}, {{“2+”, each Table.RowCount(Table.Distinct(_)), type number}})
We can’t forget to filter to customers with more than 1 distinct Membership:
= Table.SelectRows(#”Grouped Rows”, each [#”2+”] > 1)
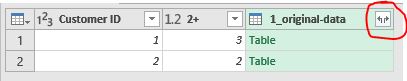
Query 4 “4_Merge-Qualifying-back-to-transactions”
We merge (join) back to the original data to get transactions for Susan & Bob.
= Table.NestedJoin(Source,{“Customer ID”},#”1_original-data”,{“Customer ID”},”1_original-data”,JoinKind.LeftOuter)
Click the double arrows and select desired columns to display from our original query 1_original-data The ‘Expand’ concept has taken time to understand.
Export results to a table!
In the top left corner select ‘Close & Load To‘. I pushed the results to this table:
One of the amazing things about Power Query is that you can add more data to the original table, quickly refresh the query and the results will be up to date!
I found it interesting that Oz du Soleil (Oz’s video) and I solved it in almost the exact same way. Great minds think alike!
Ken Puls
Thanks to Ken Puls for the fun challenge. This is Ken’s Challenge #2 Results post in which he explains the variety of solutions he received.
Enroll in Power Query Academy! I have! Disclaimer: i’m also an affiliate 🙂

About Me

I’m a Data Analyst, big Microsoft Excel fan, former SQL guy (it still comes in handy now with Power Query), Seinfeld fan, occasional chess player, co-owner of 2 cute Havanese dogs. What else?
I live in Markham Ontario Canada (ok…easier to just say ‘Toronto’).